Widgets with multiple sources
Widgets with multiple sources are widgets designed to display multiple properties of one or different objects at once. These include:
- DataChart — is a widget that combines a graph and a table. It is intended for displaying statistics of the same property of several objects.
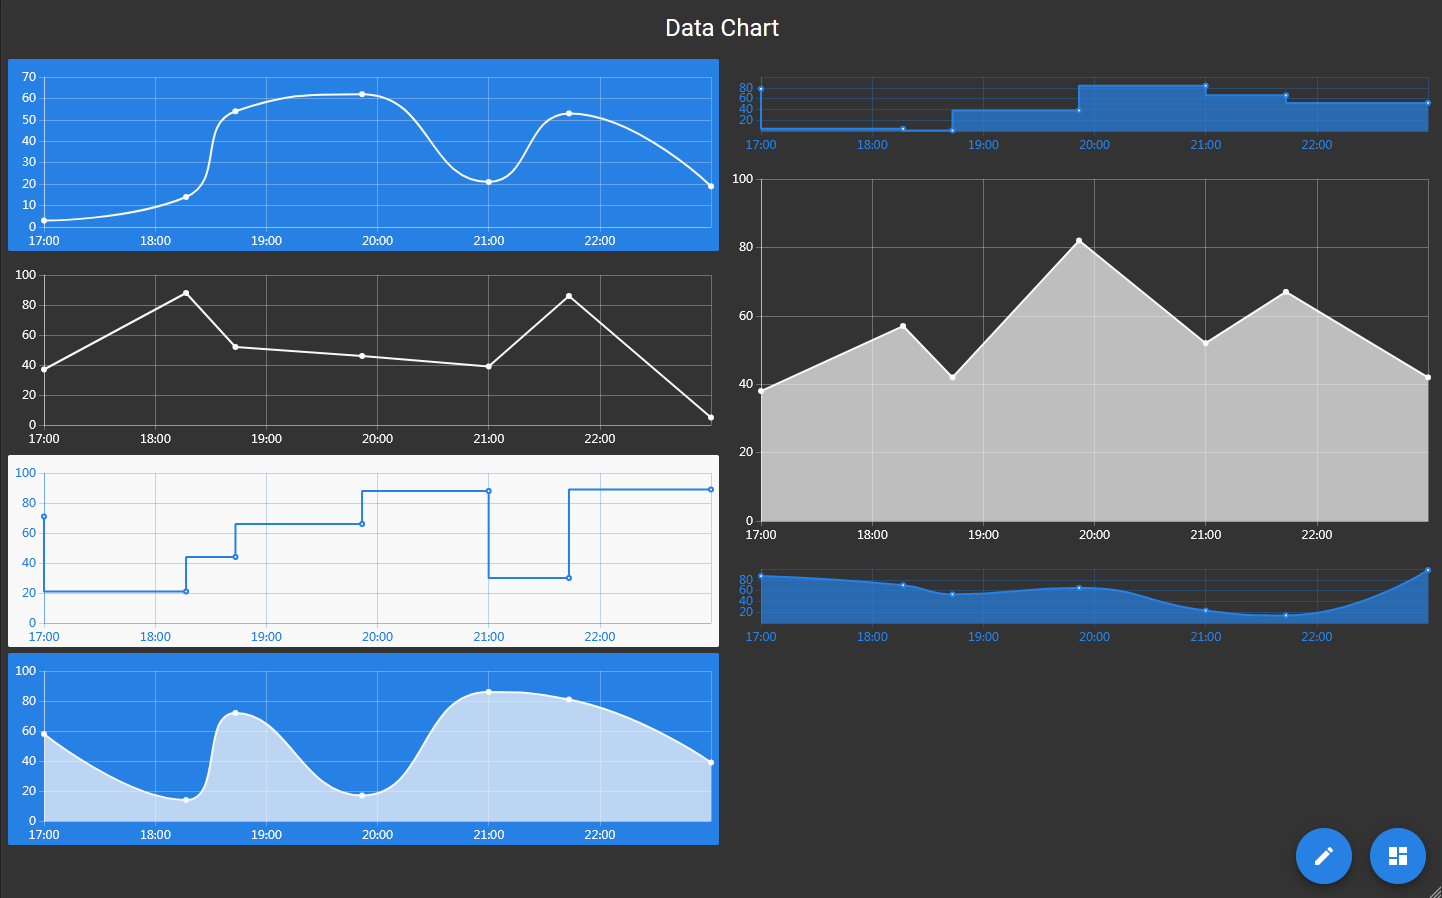
Data Chart
This widget is used to visualize changes in the properties of objects (for example, measurements) over time. From one to three charts can be displayed within one widget. A special Timeseries Statistics object serves as a data source for the widget.
Various color scheme and size settings can be selected for the graph: in this case, the size of the graph (small, medium, large) determines the height of the widget.
In addition, there are several options for configuring the graph for the widget: smoothed, linear and stepped. You can enable fill for the area under the graph. These settings are the settings of the entire widget, that is, they apply to all charts displayed inside it.